by Franklin Dumond, Director of Congregational Ministries
Since growth in a church results from the style of relationships and ministry programs, most churches will never undergo the transformational change necessary to advance to a new style of relationships and ministry. Small churches do not become large churches simply by continuing to do what small churches do. Small churches only become large churches when they begin to function, program, and relate like large churches.
To function, program, and relate differently, in new ways, can be very difficult. Transformational growth can lead to conflict and drop-out when a church changes from one style into another. Conflict in this transformational process generally comes either from those who do not want to change or from those who want to change rapidly.
For most churches, significant numerical growth is possible without transformational change. For example, the smaller, family church of 35 can become a smaller, family church of 70 or more by simply adopting new family members. (Note: Last week’s ChurchTalk reviewed three types of churches based on size and style of relationships.) Since about half of the churches in the United States are comprised of fewer than 75 people there is room for significant growth by simply including more people in the already existing framework.
Can a church predict its potential for growth? Since most churches function today much as they have in the past, a look at the past can generally predict the future.
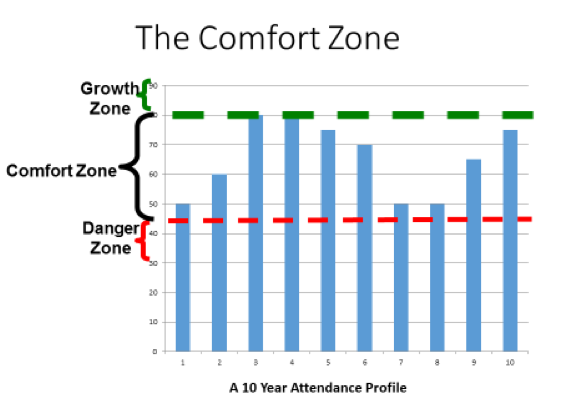
A simple tool easily completed by any church can predict the level of growth potential based on the current ministry structure of the church. This tool has been labeled as Comfort Zone Analysis. A few steps are involved in this analysis.
- Gather worship attendance averages for each of the previous 10 years. Remember that worship attendance more accurately predicts congregational life than membership rolls. Using a 10-year profile is important. This generally captures a look at two or three cycles of church growth and development. A pastor recently observed, “I’m on my third congregation now.” When he made this observation he was simply describing the turnover rate in many churches. Children grow up and move away. Older folks retire and relocate. Every five years or so most churches will have a substantial turnover in people who attend. By capturing at least two of these cycles it is more likely that the actual personality or style of the congregation is indicated in the attendance averages.
- Chart the averages on a simple bar graph with one column for each year. If information is missing for one year just leave that column empty. Average attendance can often be discovered on the annual report forms that churches submit to the denominational office. Other internal sources for attendance data can often be discovered in the annual reports, business meeting records, or church bulletin files.
- Identify the lowest annual average then draw a line across the graph just below it. This represents the danger zone for the church. It is difficult or impossible to operate the current ministries of the church if attendance is maintained in the lower range. Often a church finds a new incentive for outreach and growth when this lower limit is reached. Either there is room for new folks to find a place of service or there is a desperate need for new folks to enter to sustain the current ministries.
Some researchers contend that a church enters a danger zone that is difficult to survive when attendance drops to less than 25. - Identify the highest annual average. It is unlikely that average attendance will exceed this number unless the church undergoes a significant transformation. Most churches only reluctantly pay the price to become something new and different.
- Calculate the difference between the current annual average and the highest annual average. This represents the growth potential.
Gary McIntosh uses a similar diagram to describe the floors and lids of church growth. Once the Comfort Zone has been identified, it is easy to see how the upper limit of the current comfort zone could be seen as the lower limit of the next level. This means that if a church of 125 sustains that level for a while it may be possible to make some changes in structure or programming that would allow it to grow into a new kind of church. The addition of a new worship service, for example, sets the stage then for this church to double in attendance.
Dr. McIntosh observes that local churches appear disproportionally grouped at several typical sizes. Averages of 35, 85, 125, and 200 are typical for the small to mid-size churches. He also indicates 400, 800, 1200, 3000, 6000, and 10,000 as typical plateaus for larger churches.
For any size church moving out of its Comfort Zone, intentional steps must be taken to become something other than what they already are.