How Churches Grow: The Comfort Zone and Predicting Growth Potential

How Churches Grow: The Comfort Zone and Predicting Growth Potential

by Franklin Dumond, Director of Congregational Ministries

Since growth in a church results from the style of relationships and ministry programs, most churches will never undergo the transformational change necessary to advance to a new style of relationships and ministry. Small churches do not become large churches simply by continuing to do what small churches do. Small churches only become large churches when they begin to function, program, and relate like large churches.

To function, program, and relate differently, in new ways, can be very difficult. Transformational growth can lead to conflict and drop-out when a church changes from one style into another. Conflict in this transformational process generally comes either from those who do not want to change or from those who want to change rapidly.

For most churches, significant numerical growth is possible without transformational change. For example, the smaller, family church of 35 can become a smaller, family church of 70 or more by simply adopting new family members. (Note: Last week’s ChurchTalk reviewed three types of churches based on size and style of relationships.) Since about half of the churches in the United States are comprised of fewer than 75 people there is room for significant growth by simply including more people in the already existing framework.

Can a church predict its potential for growth? Since most churches function today much as they have in the past, a look at the past can generally predict the future.

A simple tool easily completed by any church can predict the level of growth potential based on the current ministry structure of the church. This tool has been labeled as Comfort Zone Analysis. A few steps are involved in this analysis.

  1. Gather worship attendance averages for each of the previous 10 years. Remember that worship attendance more accurately predicts congregational life than membership rolls. Using a 10-year profile is important. This generally captures a look at two or three cycles of church growth and development. A pastor recently observed, “I’m on my third congregation now.” When he made this observation he was simply describing the turnover rate in many churches. Children grow up and move away. Older folks retire and relocate. Every five years or so most churches will have a substantial turnover in people who attend. By capturing at least two of these cycles it is more likely that the actual personality or style of the congregation is indicated in the attendance averages.
  2. Chart the averages on a simple bar graph with one column for each year. If information is missing for one year just leave that column empty. Average attendance can often be discovered on the annual report forms that churches submit to the denominational office. Other internal sources for attendance data can often be discovered in the annual reports, business meeting records, or church bulletin files.
  3. Identify the lowest annual average then draw a line across the graph just below it. This represents the danger zone for the church. It is difficult or impossible to operate the current ministries of the church if attendance is maintained in the lower range. Often a church finds a new incentive for outreach and growth when this lower limit is reached. Either there is room for new folks to find a place of service or there is a desperate need for new folks to enter to sustain the current ministries.
    Some researchers contend that a church enters a danger zone that is difficult to survive when attendance drops to less than 25.
  4. Identify the highest annual average. It is unlikely that average attendance will exceed this number unless the church undergoes a significant transformation. Most churches only reluctantly pay the price to become something new and different.
  5. Calculate the difference between the current annual average and the highest annual average. This represents the growth potential.

Gary McIntosh uses a similar diagram to describe the floors and lids of church growth. Once the Comfort Zone has been identified, it is easy to see how the upper limit of the current comfort zone could be seen as the lower limit of the next level. This means that if a church of 125 sustains that level for a while it may be possible to make some changes in structure or programming that would allow it to grow into a new kind of church. The addition of a new worship service, for example, sets the stage then for this church to double in attendance.

Dr. McIntosh observes that local churches appear disproportionally grouped at several typical sizes. Averages of 35, 85, 125, and 200 are typical for the small to mid-size churches. He also indicates 400, 800, 1200, 3000, 6000, and 10,000 as typical plateaus for larger churches.

For any size church moving out of its Comfort Zone, intentional steps must be taken to become something other than what they already are.


New Metrics for the New Normal

New Metrics for the New Normal

by Franklin Dumond, Director of Congregational Ministries

Over the years church leaders have used a variety of measurements to define church growth. Traditionally these metrics have centered on average weekly attendance.

Not many years ago churches only measured small group participation by reporting Sunday School attendance. Back then attendance in Sunday School classes often exceeded attendance at worship services.

A shift in emphasis occurred so that by the new millennium worship attendance in most churches greatly exceeded Sunday School attendance.

In the ‘old normal’ it was not uncommon for only 25-50% of worship attenders to also attend Sunday School or other small group ministries.

In pre-pandemic America, the trend toward inconsistent, sporadic attendance accelerated. Not so long ago the active church member might attend three services per week and miss only a few weeks in a year. The frequency of attendance began to decline some time ago but seems to have accelerated in the booming economy. When times were good folks more often found other things to do on weekends.

A further complication that impeded consistent church attendance was the invasion of previously sacred space and time. Although Blue Laws restricting Sunday commerce disappeared generations ago, de-facto Blue Laws remained ingrained in our culture. Not so long ago school events and sporting activities were almost never held on Sunday. Now, Sunday is just another day.

The New Normal generated by the pandemic of 2020 has further restricted consistent attendance. As churches have re-gathered many have discovered that weekly in-person attendance is considerably lower than pre-shutdown. With the threat of contagion looming, many with underlying health conditions or compromised immune systems have chosen to remain absent from weekly gatherings.

A new development during the pandemic also impacts weekly attendance. The explosion of on-line, live-streaming services meant that many churches expanded their weekly participation even when weekly in-person gatherings were not scheduled.

If our old metric of average weekly attendance cannot accurately measure current activity, what metrics will rise to take its place?
Let me offer a few thoughts:

New Metrics for the New Normal
  1. If average in-person attendance remains the standard metric for the local church at the very least we cannot compare averages for 2020 with those for previous years. If in the near future we see some kind of stabilized attendance patterns we may be able to resume evaluating based on those measures with a notable asterisk* to identify 2020 as an outlier year.
  2. If on-line activity is sustained then effective metrics must be used to evaluate it. At the very least the measure should be consistent and at the best, it should actually measure meaningful or sustained rather than fleeting engagement.
    This means that the reliance on the total number of views must be balanced by the reality of length of time spent with the on-line experience or with resulting actions taken by the on-line viewer. For example, some church leaders encourage their folks to sign in with a comment when they view on-line streaming from Facebook. Other leaders choose those platforms that allow a more detailed measure of viewership rather than relying on the raw number of total views.
    On the other hand, relying on the raw number of total views may not be as unrealistic as we assume. I’ve been told that it is common for folks to be distracted, even to be daydreaming or napping, although they are present for in-person worship. Is this much different than a short view on-line?
  3. Even before we began coping with the new normal there was already widespread awareness that metrics other than raw data on weekly attendance were necessary. For example, many churches regularly evaluate how many attendees at worship also participate in a small group setting and/or serve in a ministry setting.
    Many healthy churches will set goals for increasing the level of participation in both these areas.
  4. One metric that will become increasingly important for all sized congregations will be the size of the crowd, the extended congregation. How many people attend at least once in a 6-8 week period? If this group can be identified, then the groundwork is in place to engage them in small group and ministry settings. Unless this group can be identified, then communication will be limited to those who happen to be present in-person or on-line. In the pre-pandemic setting, most churches registered an average weekly attendance that was about ½ their total number of participants. The exceptions to this are the very small churches where guests are rare and new members non-existent. In those settings everyone pretty much attends everything.
  5. At some point, the pandemic will ease and churches will again expand their programming. When that occurs one important metric will be total weekly participation. That is, how many people attended at least one element of the church’s program in one week? This does not double-dip to count every person every time they attend a church function. It does count every person who attends at least one church function in a week but the person is only counted once with no ‘extra credit’ for attending multiple services.

This process takes a little time and a little organization but is well worth the effort.

The organization requires two elements. Every ministry event must have a roster or roll sheet with people enrolled in the activity. Every person should also be enrolled in the Total Weekly Participation activity.

The time factor has two elements. First, someone must register attendance on the roll sheet for the weekly event. Second, these roll sheets must be compiled and transferred to the Total Weekly Participation Activity.

The old adage “We count people because people count!” will be as true in the New Normal as it was in the Old Normal. The difference may be that we use new metrics for a new day.

Three types of churches

Three Types of Churches

by Franklin Dumond, Director of Congregational Ministries

Anyone who studies the local church in the United States quickly recognizes that churches come in all shapes and sizes. Business franchises and fast-food chains look and function identically no matter where they are located. Local churches, however, are not carbon copies of one another.

While no two churches are exactly the same, a functional sameness often exists among churches of similar size. This generally means that similar-sized churches of different denominations function very much alike. This is especially noticeable in regard to the ways similar-sized churches reach out to new people and include them in the congregation. Understanding these similarities can help local churches understand their growth patterns and plan future outreach strategies.

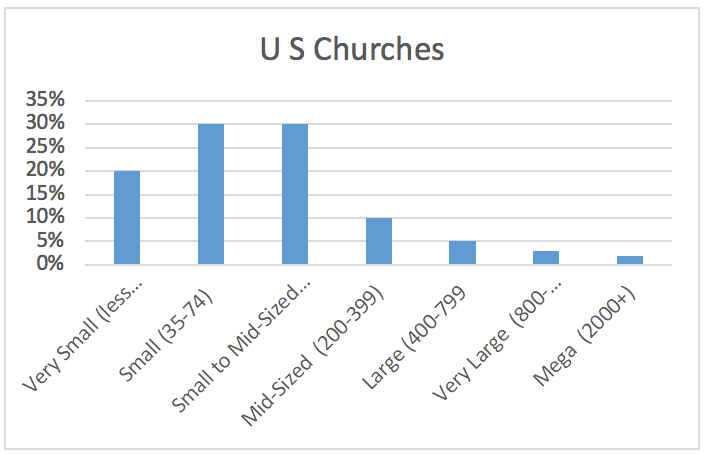
Percentages of church sizes in the US

Gary McIntosh, in his book One Size Doesn’t Fit All, uses a simple grouping of three types of churches to help explain many of these similarities. He identifies small, medium, and large-sized churches based on their average attendance. He further identifies them as a single cell, stretched cells, or multiple cells in their organization.

In a small church, everyone knows everyone else. They form a single cell. Often the common bond that links them is kinship. It is not uncommon for a small church to be composed of members from two or three extended families. These key families provide all the leadership and organization for the church’s ministry. The small church will generally be 50 or fewer in size but can easily extend to 100-150 depending on the relationships that exist within the group. For example, if an extended family that includes several generations also includes several larger families, the ‘small’ church when measured by attendance will look more like a medium-size church. Nevertheless, when measured by who are the leaders, and how close the personal relationships are, the church will qualify as a small or single-cell church.

In a medium-size church, there may be too many people for everyone to know everyone else. Often a kind of stretched cell exists where a variety of programs and ministries exist, but leaders for those programs and ministries only come from a small group of long-term members. These long term members are themselves very likely to share kinship as part of an extended family that is embedded within the congregation. A medium-sized church will generally have 100-150 in attendance but may extend to 200, 300, or even 400 depending on the expertise, leadership, and energy level of the pastor and key lay leaders.

In a large church, there are too many people for everyone to know everyone else. With numerous groups and ministries where people can become involved, the large church becomes a congregation of congregations with leadership drawn from several groups, classes, or cells. Often the large church will be staff directed or will at least have a formal board or elder structure with clarified leadership roles and terms of service. The large church will generally have 400-800 in average attendance but can include those churches of 800-2000 who are organized in similar fashions. Organizationally, the larger church of 800+ must change to take on the structures of the mega-church of 2,000+ if it is to maintain its level of operation.

A review of the number of churches in the United States shows that the median size of a US church is 75. This means that 50% of all churches have 75 or fewer in average attendance while 50% also have 76 or more in average attendance according to the National Congregations Study by Duke University. George Barna’s research also discovered that 60% of churches have 100 or fewer in attendance.

Whether large or small, churches exist to proclaim the gospel and to advance the Kingdom. But does the large church grow in the same way the small church does? Will the outreach strategy for a very large church be the same as that of a very small church? Significant frustration surfaces when a style or method of outreach that is appropriate for one size church is attempted in another size church setting. This does not mean that churches do not want to grow. It does mean that different churches will grow differently.

While the specific strategy for a local church must be customized for that local church, there are principles that will guide churches in their growth. Here are three principles that provide a foundation for growth in any size church.

  1. Understand who you are as a church. Are you a small church that features close, personal, family-type connections? Are you a middle-sized church with a capable pastor who recruits and inspires key leaders? Are you a large church with an above-average communicator as Lead Pastor and a stellar worship team that attracts crowds?
  2. Determine what it is that you do best and then do it often! Build on your strengths.
  3. Identify existing programming to find those ministries that need improvement. Begin to correct weaknesses one or two at a time.

These principles provide a foundation for outreach and growth.